Resolving Discrepancies Between Report Totals for Sales & Materials Cost
Want to see what materials were used in each invoice and either total or per part used? In this post, we will be digging into best practices and exploring how to resolve discrepancies between report totals for Sales and Materials Cost.
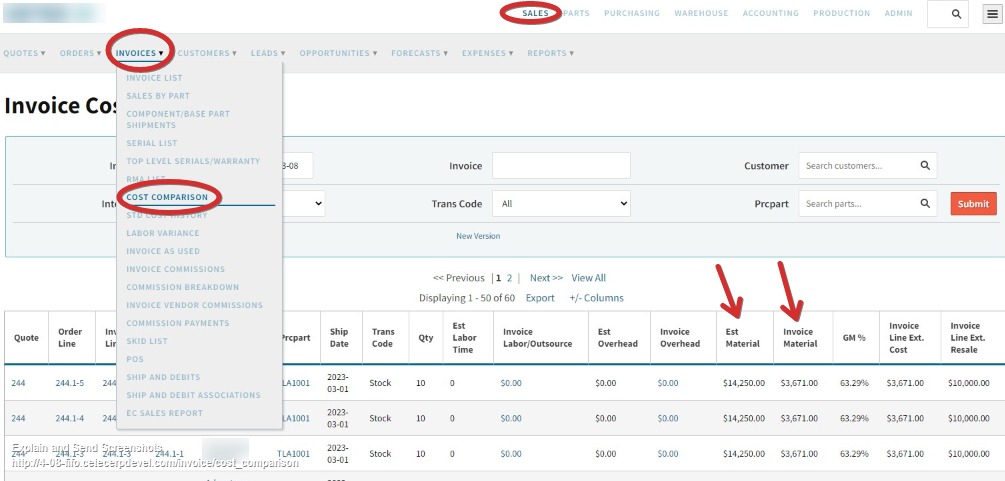
When trying to figure out how much in materials cost were used for each invoice for a date range, users will begin in the Sales page, navigate to the Invoices dropdown menu, and select “Cost Comparison” from the dropdown menu.

In reviewing this report, perhaps you find you have a discrepancy between the Cost Comparison figures and financial statement figures. In that case, set your filters on your financials for the same data range as the Invoice Cost comparison report.
For example, let’s say a date range from 1/1/23 to 1/31/23 for the P&L shows the invoice dollars and material dollars don’t add up on the financial statement. The financial statement is showing gross sales of $298,055.69, but invoices add up to $331,268.46. Materials cost shows $144,624.90, but invoice costs indicate an amount of $177,431.95.
Let’s look at some reasons why this would be the case. It could be due to the invoice GL transaction mappings (configuration settings). Or, it could be due to inventory adjustment GL mappings (i.e. what accounts are being credited/debited when inventory is adjusted).
We recommend to start by checking those mappings where inventory/COGS/revenue is impacted by a transaction (internal invoice, external invoice, inventory adjustment, etc.), then running a test transaction to make sure those are flowing smoothly.
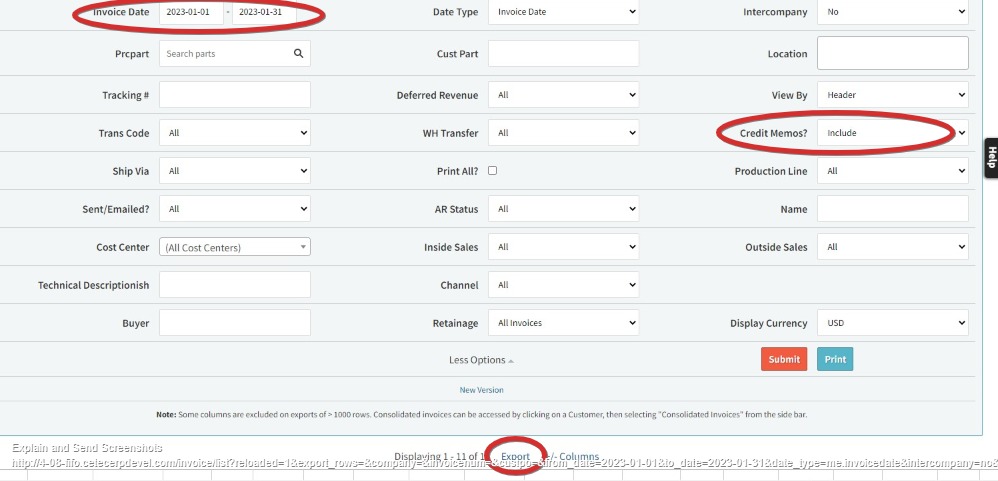
For the particular date range indicated, you can go to the Sales tab, then navigate to the Invoices dropdown menu and select “Invoice List”. Input the same date range, click “more options” and change “Credit Memos?” to “Include”. Hitting “Submit” will get you a full list of Invoices, including Credit Memos, as seen in this screenshot of the report:

If you “Export” the report to Excel, you can create a Sum of the Total column and will then see there is a total Resale of $298,055.69, which matches the Trade Sales total on your P&L for the same date range.
Keep in mind that sometimes there may be differences between the Invoice List total and A/C Trade Sales total if ‘Revenue G/L Account’ has been set in Parts or PRC lists.
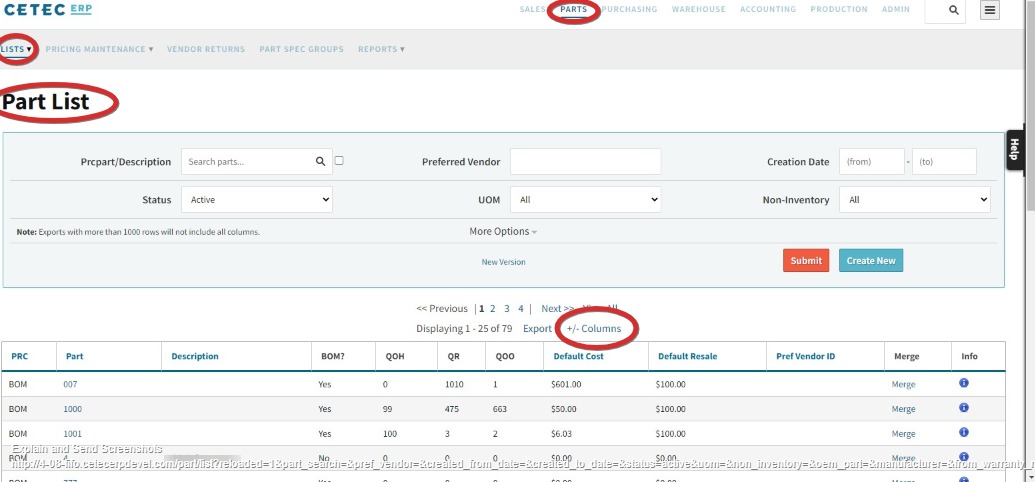
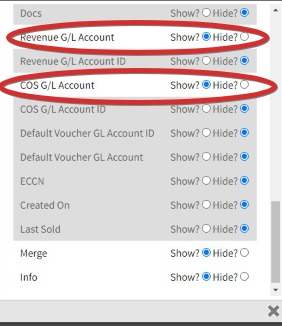
To check if either of these are affecting your totals at the Part level, go to the Parts tab, then navigate to the Lists dropdown menu and select “Part List”. You may need to click on +/- Columns to ‘Show’ Revenue G/L Account and COS G/L Account.
To check if either of these are affecting your totals at the PRC level, go to Parts tab, find the Lists dropdown menu, and select “PRC List”. You may need to do the same as above with +/- columns.

